Testing
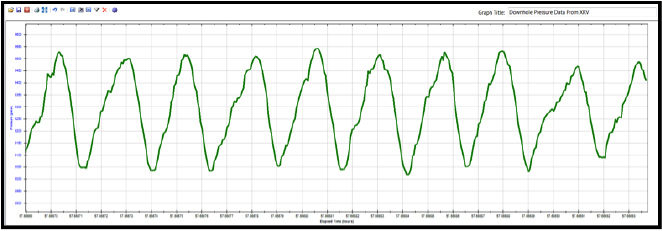
The graph above is data recorded from TTS Drilling Solutions Downhole Data Recorder
The plot above is pressure data recorded directly above the XRV while drilling. The peaks and valleys seen above depict the valve like action that is operating inside the tool. The differential pressure between the peak and valley is the driving force for generating the oscillating hydraulic load that breaks static friction between the drill string and the wellbore.
Fit for Purpose
TTS Drilling Solutions offers customizable solutions to meet your operational requirements.